Exploring Hacker News Posts
Final Jupyter Notebook can be found here.
Full data set can be found here. For this project, it has been reduced to 20,000 rows. The columns included in the data are:
id: the unique identifier from Hacker News for the posttitle: the title of the posturl: the URL that the posts links to, if the post has a URLnum_points: the number of points the post acquired, calculated as the total number of upvotes minus the total number of downvotesnum_comments: the number of comments on the postauthor: the username of the person who submitted the postcreated_at: the date and time of the post’s submission author: the username of the person who submitted the post created_at: the date and time of the post’s submission
We are specifically interested in posts with titles that begin with either Ask HN or Show HN. We will compare these two types of posts to determine:
- Do Ask HN or Show HN recieve more comments on average?
- Do posts created at a certain time receive more comments on average?
Import the data, separate the header and data, and preview
opened_file = open('hacker_news.csv')
read_file = reader(opened_file)
hn = list(read_file)
hn_header = hn[0]
hn = hn[1:]

print(hn_header)
print('\n')
for row in hn:
    print(row)
We will separate posts for Ask HN and Show HN into different variables. We’ll explore these separately.
ask_posts = []
show_posts = []
other_posts = []

for row in hn:
    title = row[1]
    if title.lower().startswith('ask hn'):
        ask_posts.append(row)
    elif title.lower().startswith('show hn'):
        show_posts.append(row)
    else:
        other_posts.append(row)
The length of Ask posts is 1744.
The length of Show posts is 1162.
The length of Other posts is 17194.
Now, let’s determine the average number of comments for both post types.
The average number of show comments is 10.32. The average number of ask comments is 14.04.
The average number of Ask HN comments is almost 4 comments higher than the average number of Show HN. This is to be expected because the Ask HN posts are requesting feedback and thoughts from the community.
Since Ask HN posts elicit more comments than Show HN posts, we will focus our remaining analysis on those posts. Now let’s determine if there are certain times when Ask HN posts are more likely to attract comments. We’ll bin by hour and use a dictionary to create this info.
# calculate the number of ask posts and comments by hour created

result_list = []

for row in ask_posts:
    result_list.append([row[6],int(row[4])])

counts_by_hour = {}
comments_by_hour = {}

for row in result_list:
    hour = dt.datetime.strptime(row[0],'%m/%d/%Y %H:%M')
    hour = hour.hour
    if hour not in counts_by_hour:
        counts_by_hour[hour] = 1
        comments_by_hour[hour] = row[1]
    else:
        counts_by_hour[hour] += 1
        comments_by_hour[hour] += row[1]
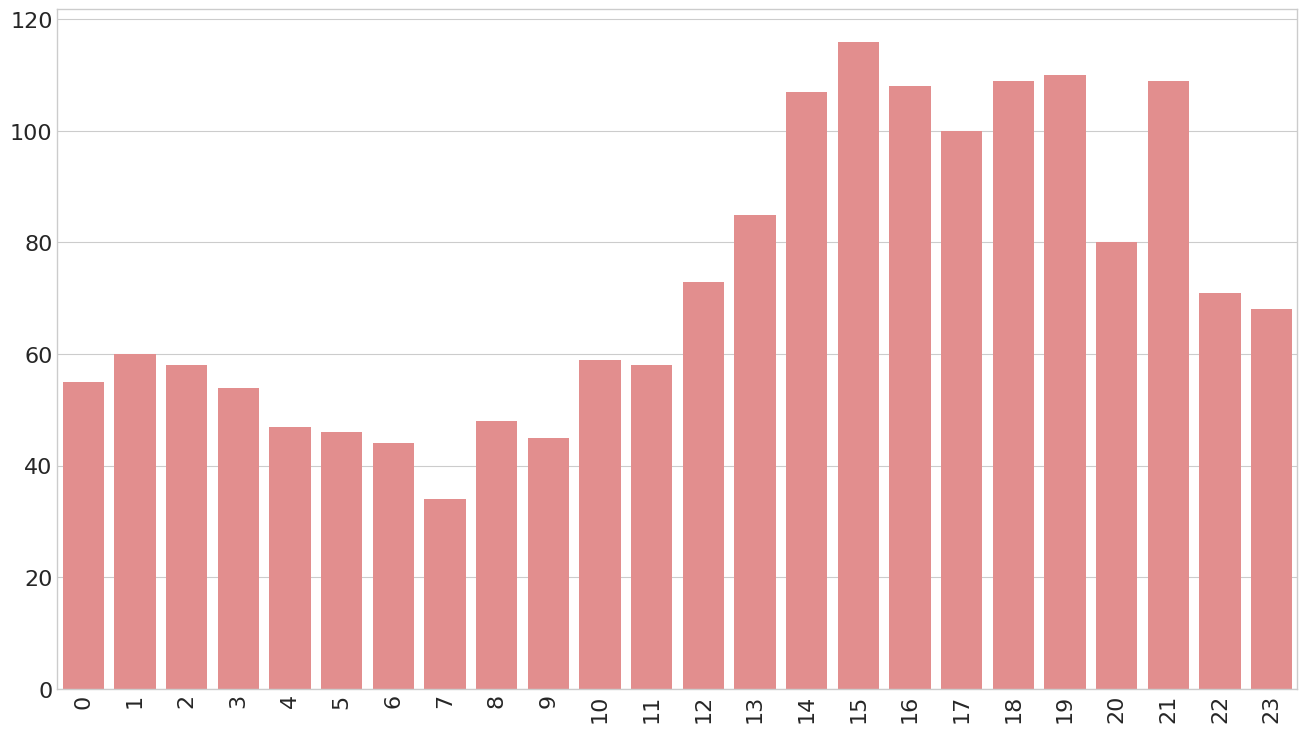
Here’s plot of the average number of posts per hour:
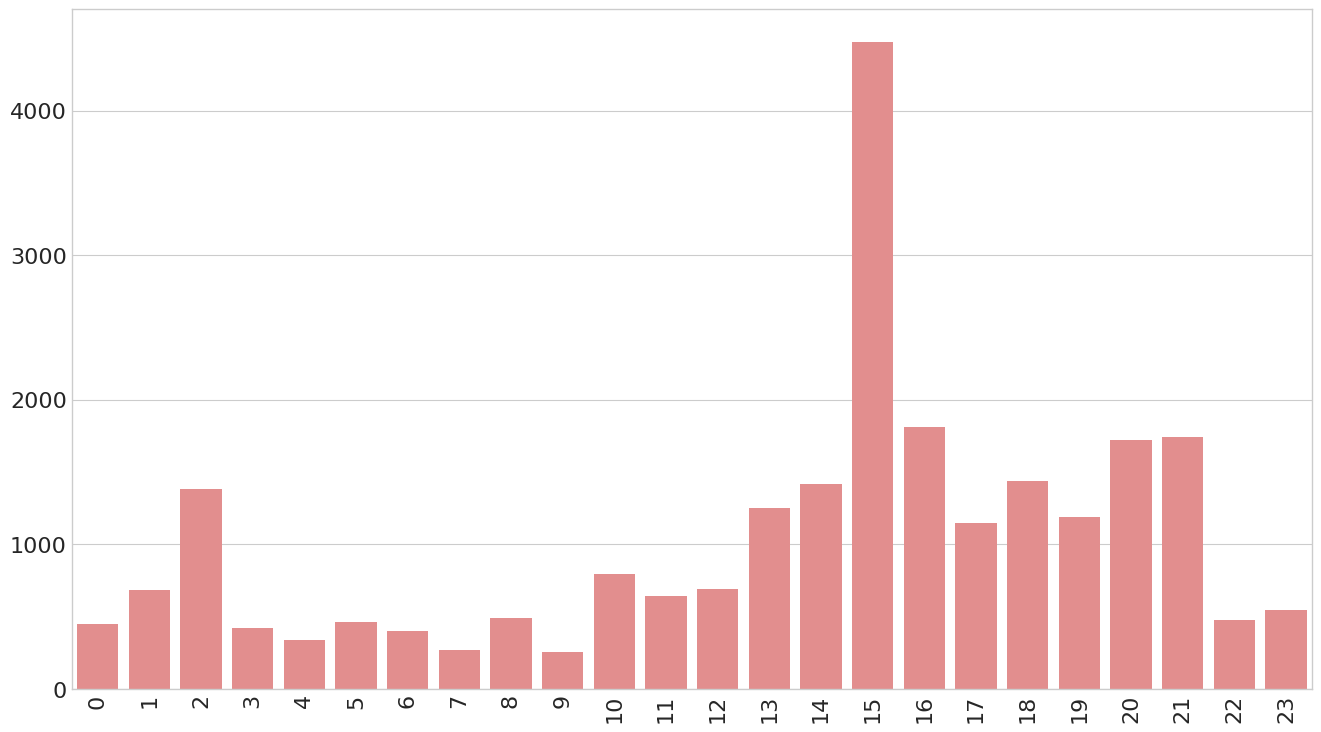
And here’s a plot of the average number of comments per hour:
Finally, we calculate and plot the average number of comments per hour:
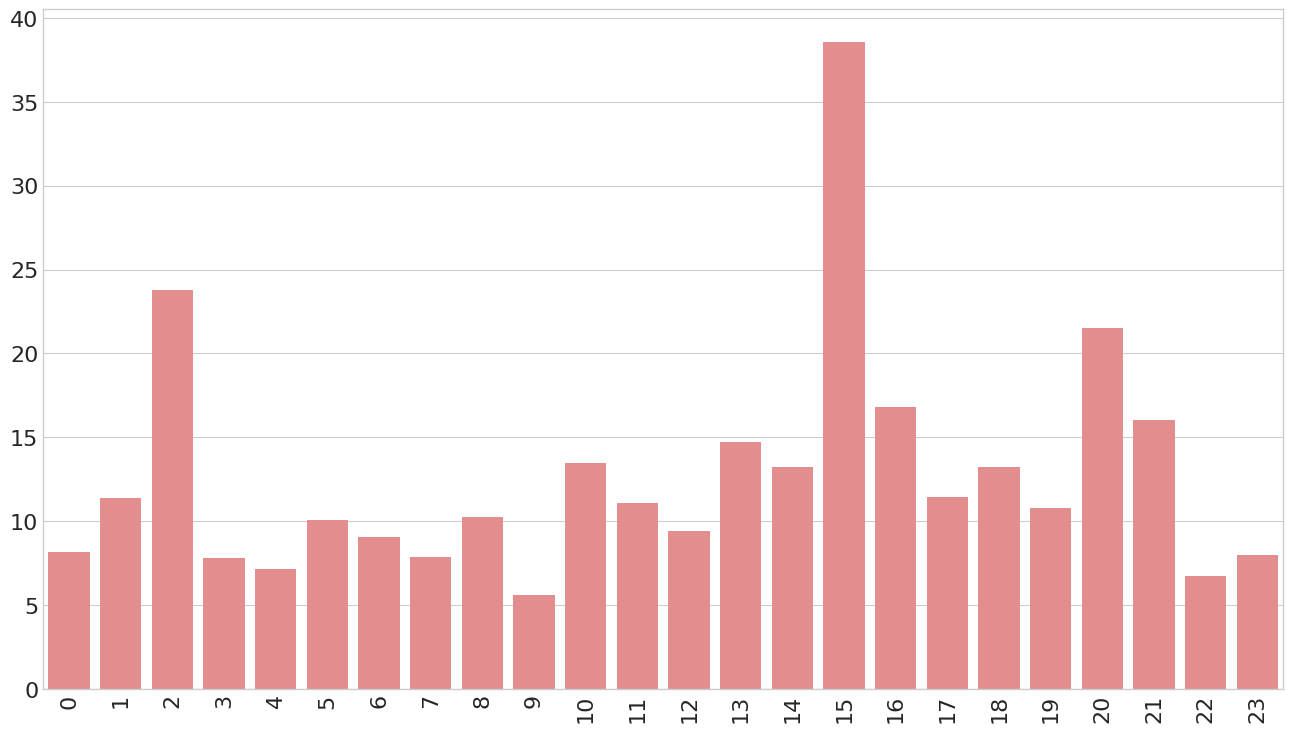
The 5 top times to post Ask HN posts to garner the most comments is 15, 02, 20, 16, and 21. These times are all Eastern time in the U.S. The mid-afternoon top time of 15:00 might correspond to when people need a break at work. This would also be supported by the 16:00 popularity. The 02:00 time in intersting and might correspond to Europeans waking up and reading HN before work. The 20:00 and 21:00 popularities might correspond to evening/hobby reading in the U.S.
Number of Points
Now, let’s investigate whether Ask HN or Show HN posts receive more points, on average. We’ll be able to use most of the code we have written above, so we’ll jump to the highlights.
The average number of Show points is 27.56. The average number of Ask points is 15.06.
Show HN receive, on average, significantly more points than Ask HN. This makes sense because these posts are showing users interesting projects or products. Similarly to before, let’s look at the posting times of Show HN posts to see if there is an optimal time to post these to garner max points from the community.
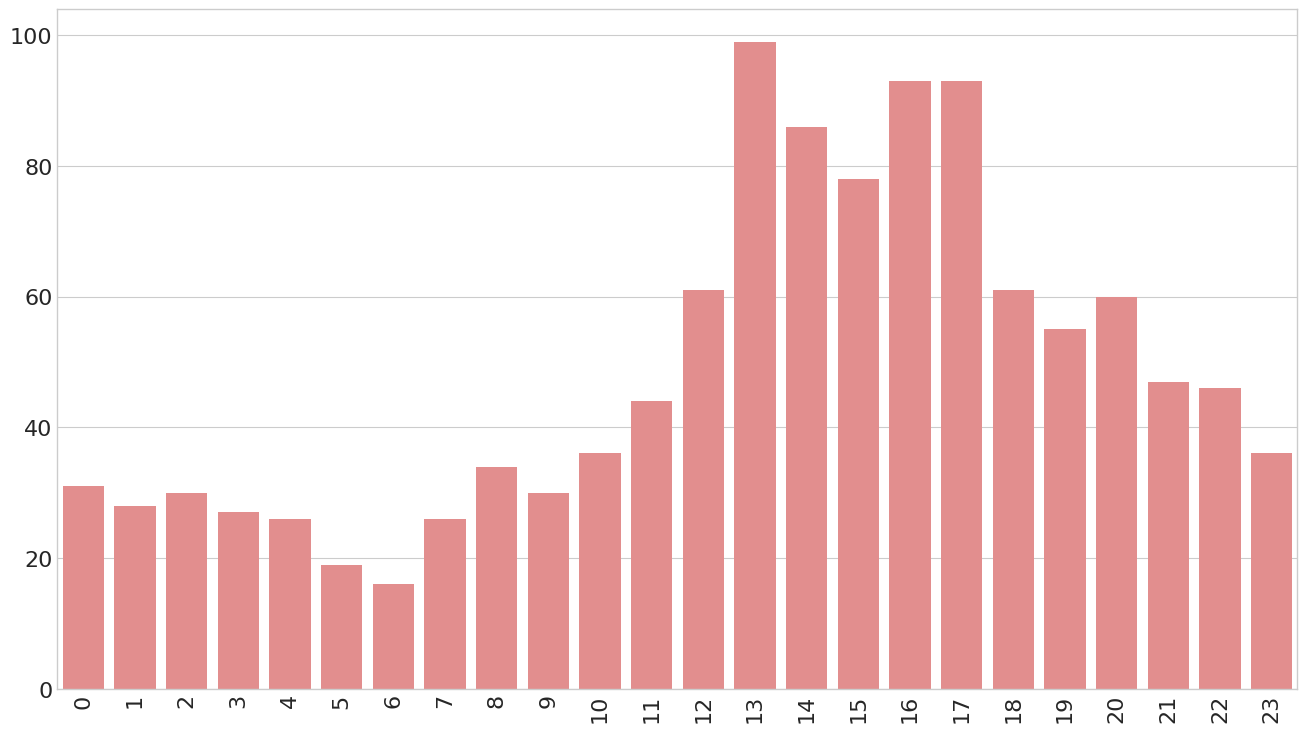
Let’s focus on Show HN posts to perform a similar analysis to before. Here is the number of Show posts per hour:
And the number of Show points per hour:
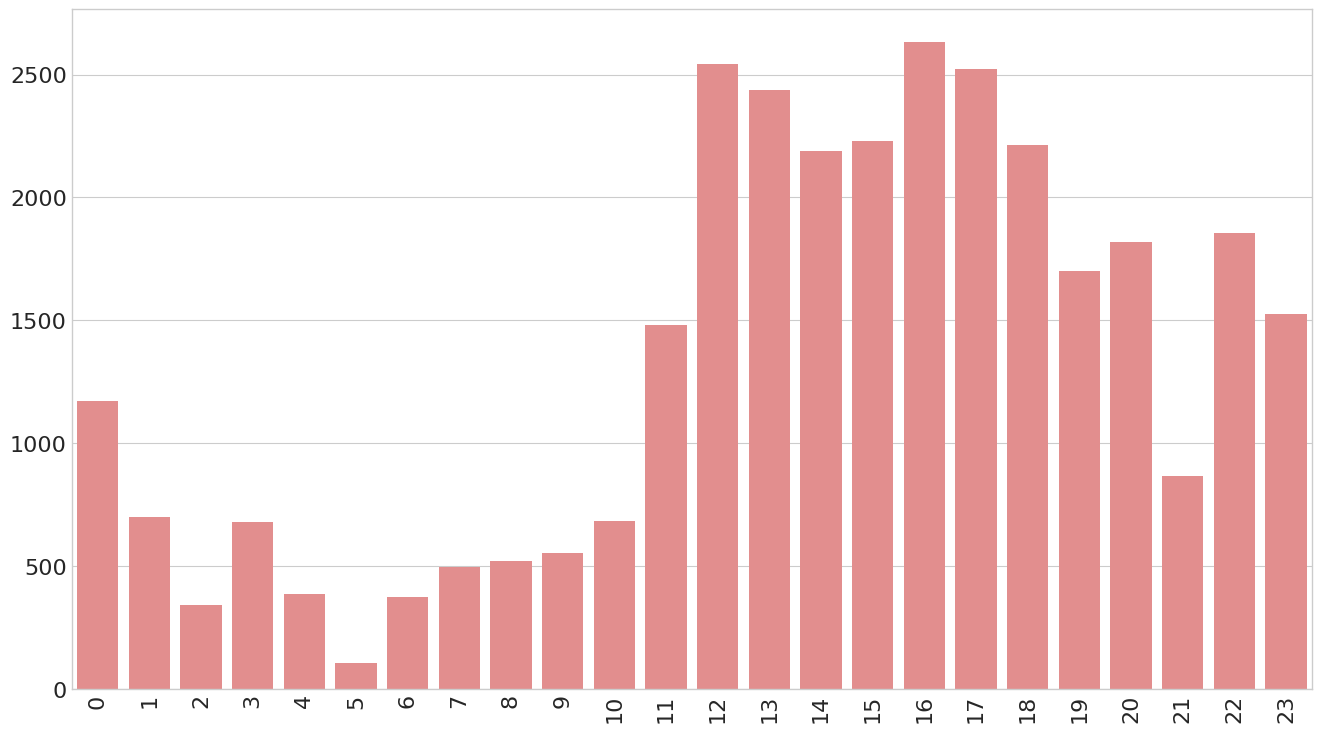
And finally, the average number of points per hour:
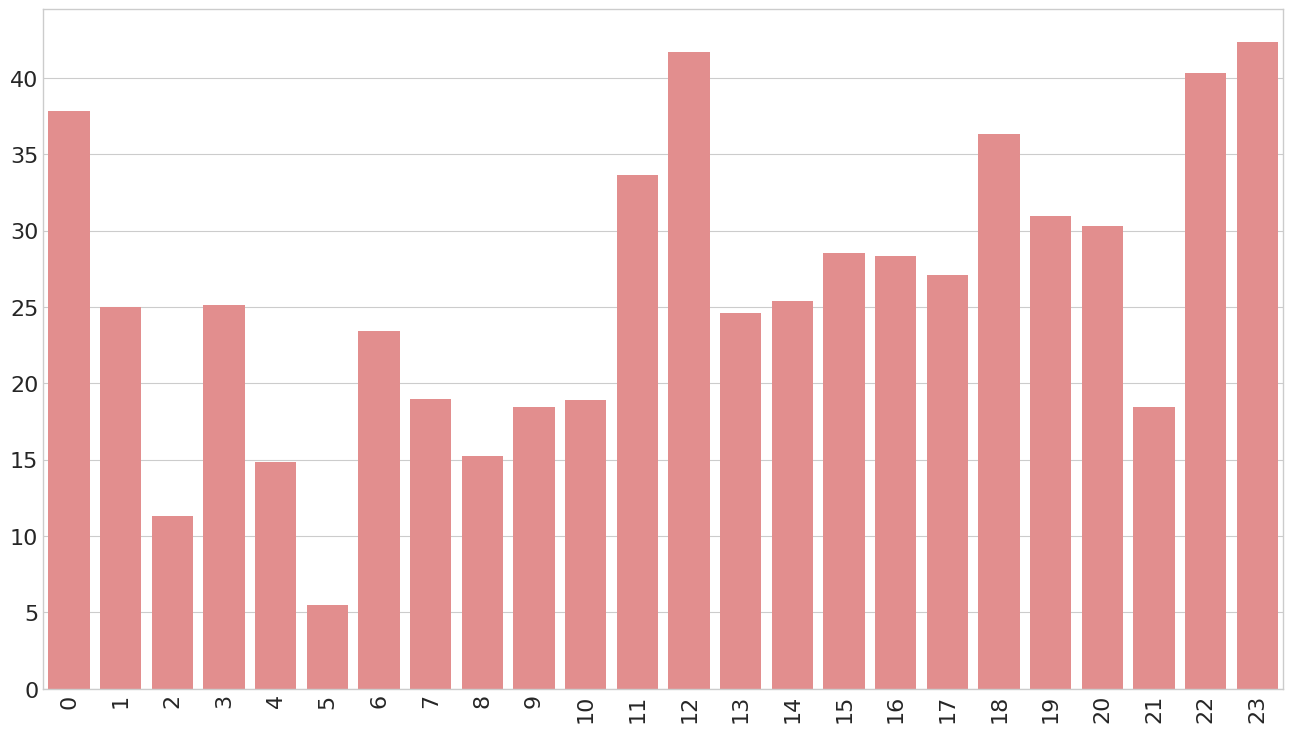
We see that there closer to a flat distribution of points per hour garnerd by Show HN posts. Posts in the middle of the night (01:00-10:00) tend to get fewer points on average. Late morning or late evening are the best times to post these types of posts.