Finding the Best Markets to Advertise In
You can find the full Jupter notebook on GitHub.
Let’s assume that we’re working for an an e-learning company that offers courses on programming. Most of our courses are on web and mobile development, but we also cover many other domains, like data science, game development, etc. We want to promote our product and we’d like to invest some money in advertisement.
Goal
Our goal in this project is to find out the two best markets to advertise our product in.
Data
We will use data from freeCodeCamp’s 2017 New Coder Survey. freeCodeCamp is a free e-learning platform that offers courses on web development. Because they run a popular Medium publication (over 400,000 followers), their survey attracted new coders with varying interests (not only web development), which is ideal for the purpose of our analysis.
The survey data is publicly available in this GitHub Repo.
Checking for Sample Representativity
As we mentioned earlier, most of the courses we offer are on web and mobile development, but we also cover many other domains, like data science, game development, etc. For the purpose of our analysis, we want to answer questions about a population of new coders that are interested in the subjects we teach. We’d like to know:
- Where are these new coders located.
- What are the locations with the greatest number of new coders.
- How much money new coders are willing to spend on learning.
Before starting to analyze the sample data we have, we need to clarify whether it’s representative for our population of interest and it has the right categories of people for our purpose.
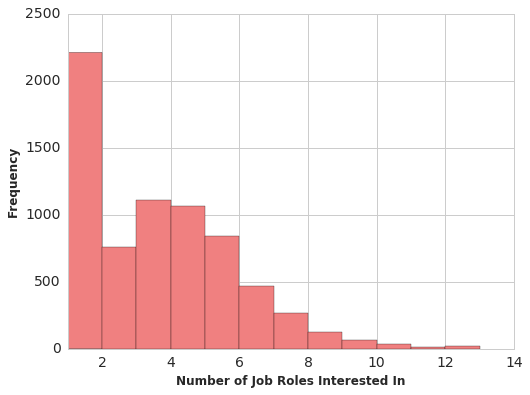
When we look at the JobRoleInterest column, we see that is is common for people to list more than 1 role they are interested in. In fact, only 31% of survey respondants have a single job they are interested in pursuring. We can view this with a frequency histogram below.

The focus of our courses in web and mobile development. Let’s see how many people are interested in at least one of these two subjects. We pick these out by using
web_or_mobile = interests_no_nulls.str.contains(
    'Web Developer|Mobile Developer')
So 86% of our survey respondants have an interest in Web or Mobile Development. This is great!
New Coders - Locations and Densities
Now that we know our survey has the right categories of people for our interests, let’s begin analyzing it. To start, let’s look at where people are located. We will use the CountryLive column, which describes where participants currently live. Let’s generate a frequency table for this column. We will omit participants who did not respond with what job role they are interested in.
| Absolute Frequency | Percentage | |
|---|---|---|
| United States | 3125 | 45.7 |
| India | 528 | 7.7 |
| United Kingdom | 315 | 4.6 |
| Canada | 260 | 3.8 |
| Poland | 131 | 1.9 |
| Brazil | 129 | 1.8 |
The frequency table is large, so we only include the top portion here. We see that the largest number of survey participants is from the US. Then it is a long drop to India, the UK, and Canada.
This is helpful for directing the advertising, but we also care about how much participants are willing to spend, so let’s go look at that.
Spending Money for Learning
We need to go more in depth with our analysis before making a decision about which markets to invest in. Let’s now take a look at how much money new coders are willing to spend on learning. The MoneyForLearning column describes in US dollars the amount of money spent by participants from the moment they started coding until they completed the survey. Our company sells subscriptions at a price of $59 per month, so we want to know per month rates.
Let’s also narrow our focus to the four countries with the most new coders: US, India, UK, and Canada.
We first replace any indications of 0 months of programming with 1 so that we do not divide by 0:
survey_no_job_nulls['MonthsProgramming'].replace(0,1,inplace=True)
Then we group by the CountryLive column and calculate the mean of the four contries we are interested in.
| Mean Monthly Spending | |
|---|---|
| United States | 227 |
| India | 135 |
| United Kingdom | 45 |
| Canada | 113 |
Users in the UK spend significantly less than users in the other 3 countries we are considering.
Dealing with Extreme Outliers
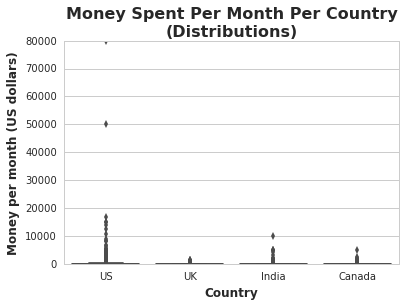
Let’s investigate these distributions a little more, by generating box plots of the monthly spending.

We see that the US has two individuals who spend 50,000 and 80,000 per month on learning. This seems extremely unlikely, so we will remove these two values. There are no extreme outliers visible so far for the UK, India, or Canada. We go through this process a few times, keeping an eye out for outliers. But remembering that the upper limit we pick is somewhat arbitrary.
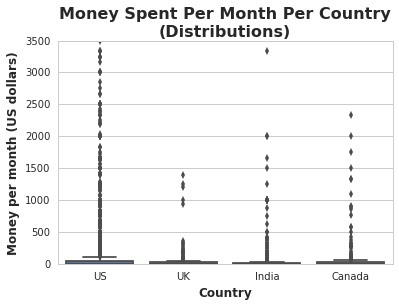
These are relatively small numbers we are dealing with, but for consistency, let’s remove all participants who indicated they spent more than 4,000 a month on learning.

We see that our distribution is still dominated by the outliers, but this will get us close enough to what we need for now. And we update our monthly spending table:
| Mean Monthly Spending | |
|---|---|
| United States | 119 |
| India | 72 |
| United Kingdom | 45 |
| Canada | 93 |
Choosing the Two Best Markets
We have done enough analysis that we are ready to make our decision on the two best markets to advertise in.
The US is the clear first choice. It has the largest numbers of active users seeking to learn and users in the US spend the largest amount per month at around 119.
The second choice is a little more difficult to make. While learners in Canada are willing to spend the second most at 93 per month, they make up only 6% of the four countries we are analyzing. India makes up the second most, at 11%, and users in India are willing to spend around 72 per month, well about our 59 per month price tag. Finally, we see that around the same percentage of learnes (15%) in both Canada and India currently spend more than 59 per month. This might indicate that we would see the same level of adoption of our service in both countries.
Deciding a second country to advertise in is a balance between the available market and price point.