Popular Data Science Questions
You can find the full Jupter notebook on GitHub here.
In this project, we will explore some of the most asked questions on Data Science Stack Exchange. To access the data, we will use the Stack Exchange Data Explorer. This is a convinient public database Stack Exhange provides for each of its websites.
After exploring the data model, the Posts table has the information that we will need.
Data Dictionary
Id: An identification number for the post.PostTypeId: An identification number for the type of postCreationDate: The date and time of creation of the post.Score: The post’s score.ViewCount: How many times the post was viewed.Tags: What tags were used.AnswerCount: How many answers the question got (only applicable to question posts).FavoriteCount: How many times the question was favored (only applicable to question posts)
Since we only want posts that are questions, we select only PostTypeId = 1
Query the Data
The following query gets us the data we want:
SELECT Id, PostTypeId, CreationDate, Score,
  ViewCount, Tags, AnswerCount, FavoriteCount
  FROM Posts
  WHERE PostTypeId = 1 AND YEAR(CreationDate) = 2019;
Explore and Clean the Data
After importing the data, we run df.info() to look at data types and missing data.
There are 8839 rows of data. The only column with missing data is FavoriteCount. A missing value in this column probably means the post was not listed as a favorite for anybody, so we can replace the NaNs with 0. We will also convert the column to an Int data type.
df.fillna(value={'FavoriteCount':0},inplace=True)
df['FavoriteCount'] = df['FavoriteCount'].astype(int)
We will want to use the CreationDate column as a datetime object, so next we convert that column:
df['CreationDate'] = pd.to_datetime(df['CreationDate'])
And finally, let us clean the Tags columns so that each tag is a string comprised of possibly multiple tags, each separated by commas.
df['Tags'] = df['Tags'].str.replace("^<|>$", "").str.split("><")
The data has been cleaned and we are ready to use it.
Most Used and Most Viewed
We now focus on determining the most popular tags. We’ll do so by considering two different popularity proxies: for each tag we’ll count how many times the tag was used, and how many times a question with that tag was viewed.
We create a dictiony (that we’ll later convert to a dataframe, counting the number of times a tag was used:
tag_count = dict()
for x in df['Tags']:
    for tag in x:
        if tag in tag_count:
            tag_count[tag] += 1
        else:
            tag_count[tag] = 1
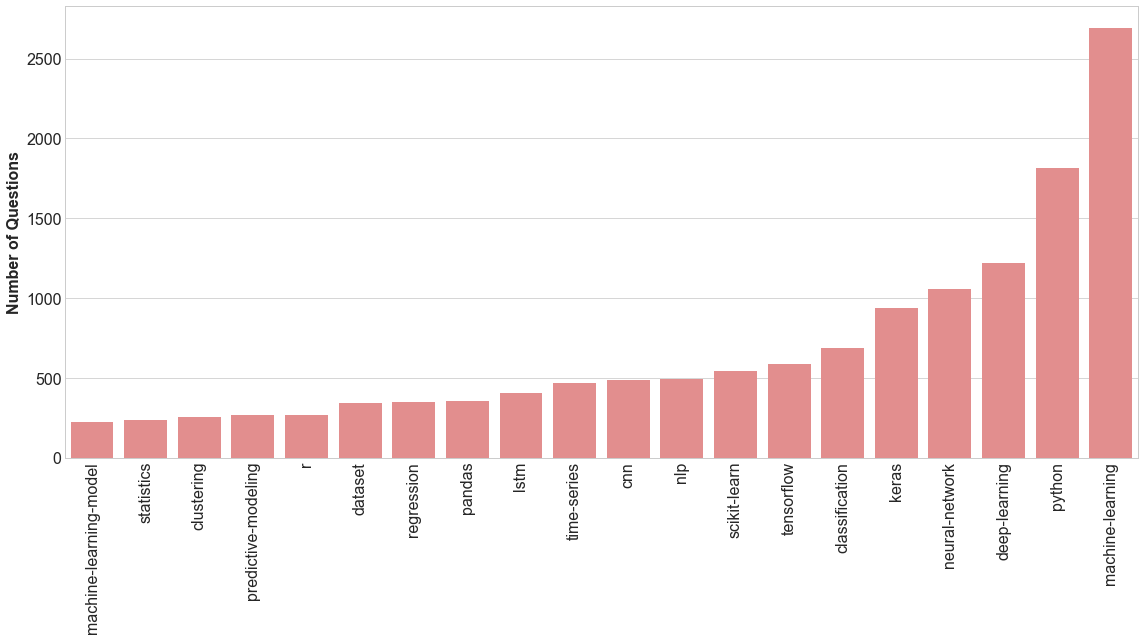
If we pick the 20 most popular tags, we can visualize them as shown below.

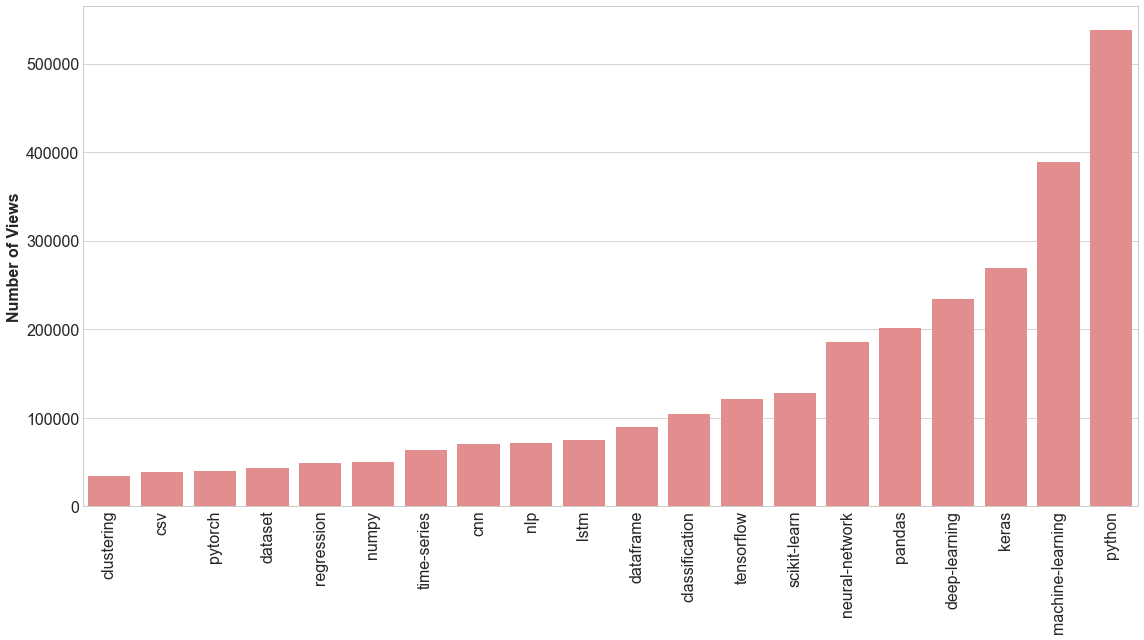
We can perform the same type of analysis to gather the 20 most popular tags to view.

Is Deep Learning a Fad?
We saw above that deep learning appeared on both most_viewed and most_popular. We will spend some time investigating how interest in deep learning has changed over time. This will help us understand whether or not deep learning is a fad.
We will start by important a dataset that contains all questions asked on Data Science Stack Exchange since 2014. We have to clean this dataset in a similar way to our earlier dataset.
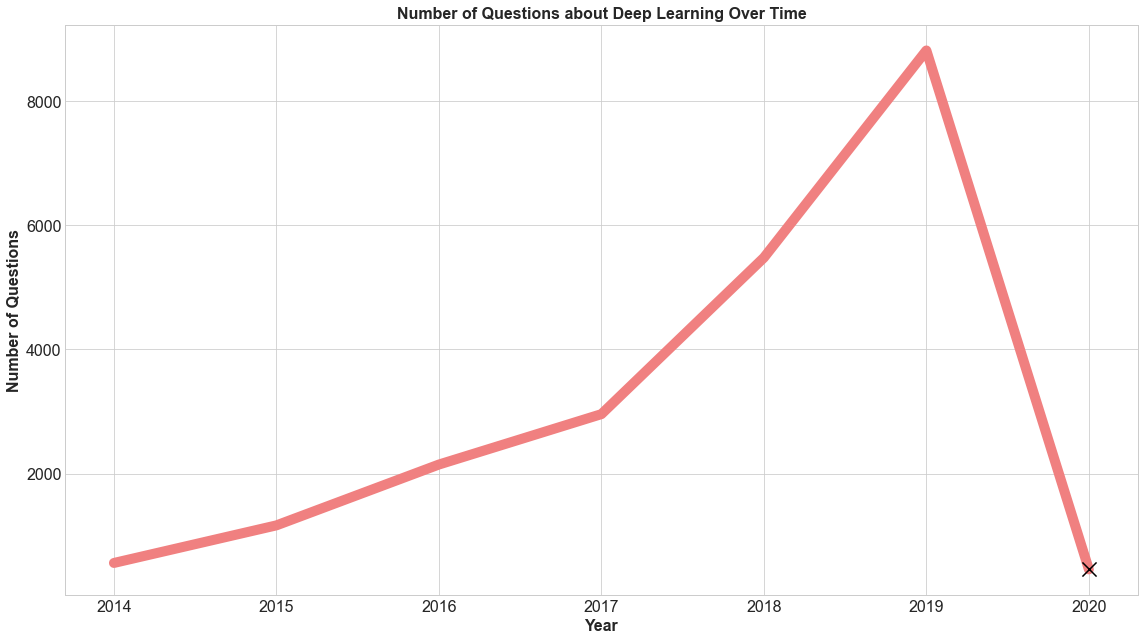
We will start by grouping by year to see how the popularity of deep learning has changed.
year_popularity = all_questions['CreationDate'].groupby(by=all_questions['CreationDate'].dt.year).size()

We see that since 2014 (the first year of this dataset), the number of questions related to deep learning increased quickly through 2019. However, there is a drop in 2020. Before we draw any conclusions from this, let’s see how much of the year 2020 is included in the dataset. We find that that dataset ends in the first month of 2020. So we would not attribute the dip in the above graph to anything. We have added an X in the graph to indicate we should be wary of overinterpreting this.