Helicopter Escapes - Lists and simple loops
I recently started the DataQuest Data Science in Python path. Even though I’ve been using Python for a number of years, I started at the beginning. I just completed the first project looking at Helicopter Escapes. It’s been going quickly, but I have been reminded of a few best-practices.
You can find the full project on my GitHub here, or read below for some highlights.
We loaded the data directly from Wikipedia from the List of helicopter prison escapes. We simply called the data data, which is just a list.
There were six columns in data
| Date | Prison Location | Country | Successful? | Names of escapee(s) | Description |
We didn’t care about the description so we removed it at this point:
index = 0
for row in data:
    data[index] = row[:-1]
    index += 1
We next wanted to look at attempts per year, so we used a lambda function to find the min and max year
min_year = min(data, key=lambda x: x[0])[0]
max_year = max(data, key=lambda x: x[0])[0]
Finally, we can loop through our data to compile the number of attempts per year. I won’t include it here, but attempts_per_year is a list of lists that was initialized with two elements: the years and 0. (i.e. [1971,0]).
for row in data:
    for ya in attempts_per_year:
        y = ya[0]
        if row[0] == y:
            ya[1] += 1
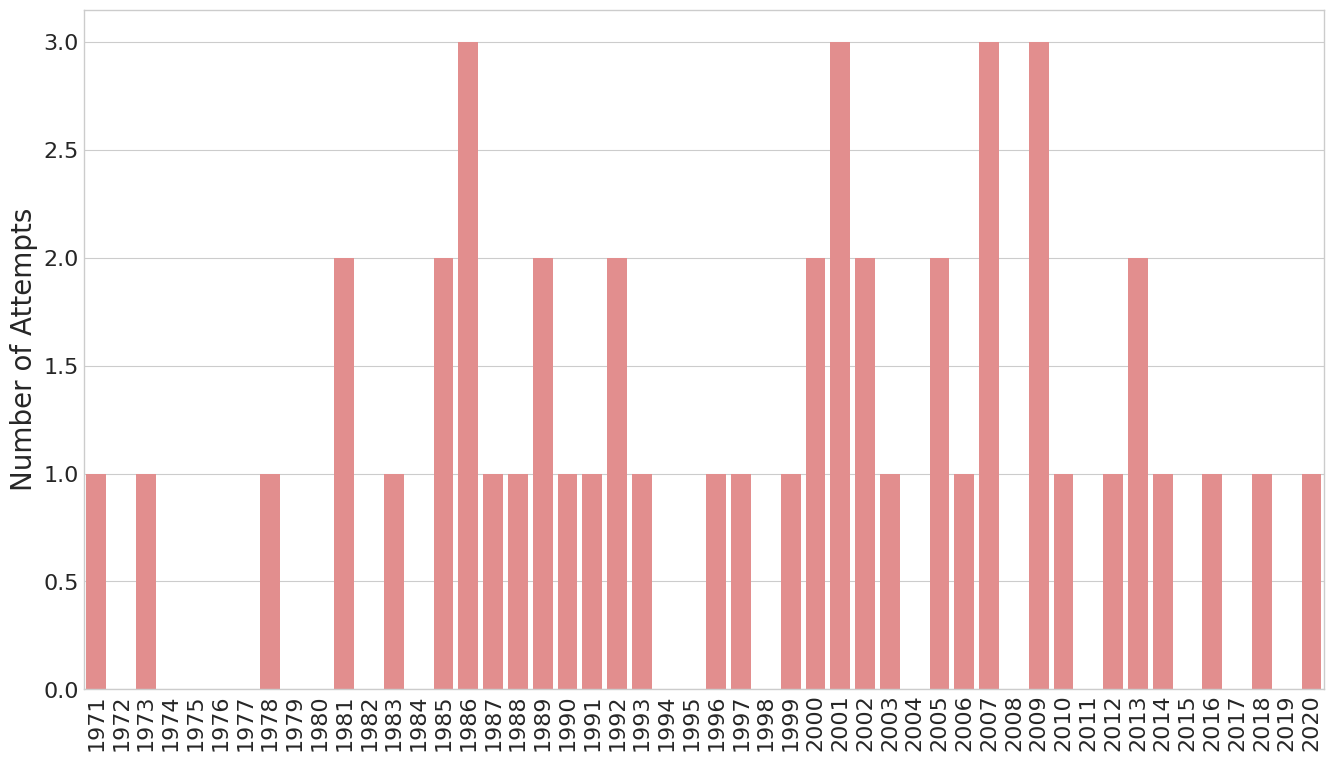
DataQuest had a built-in function to plot a simple bar plot of this. I found it hard to read. So I plotted the data in Seaborn instead. I have recently started using Seaborn frequently and like how intuitive and customizable it is.

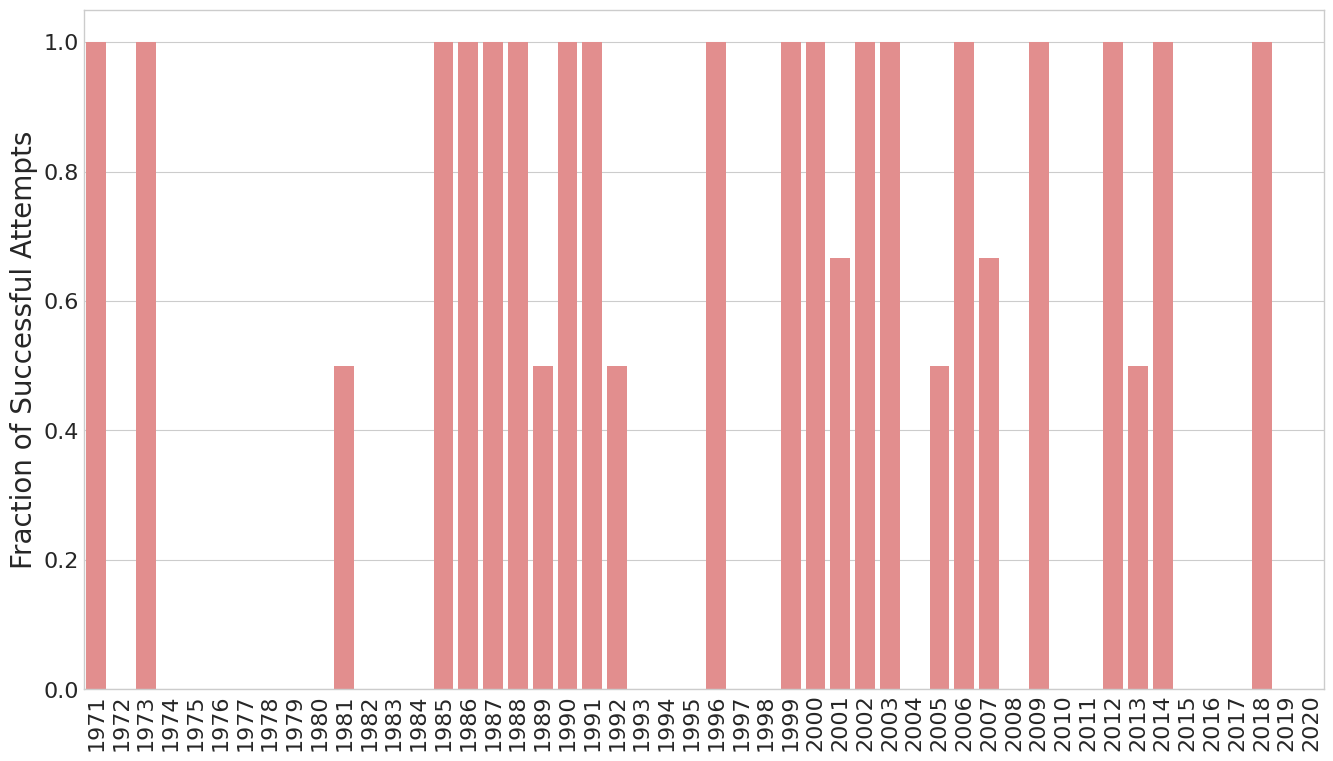
I was also curious how many of these were successful, as a fraction of the number of attempts that year.

These are small number of statistics, especially since the largest number of attempts in a single year was 3. But we don’t see an obviously significant change in how successful these attempts were.